Main Control Dashboard
The central hub where homeowners view all connected rooms, adjust temperature zones, toggle lighting presets, and monitor active automations at a glance.
Monthly Energy Breakdown
Detailed charts displaying electricity consumption per room over the past billing cycle. Color-coded segments highlight which zones consume the most power.

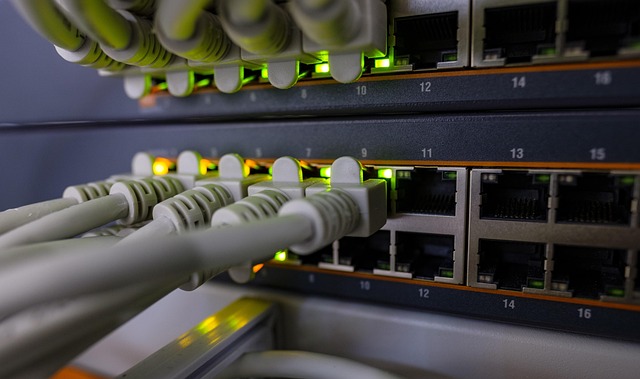
Thermostat Integration Flow
Visual schema showing how smart thermostats connect to our cloud backend via Wi-Fi, sync temperature data, and receive automated scheduling commands.
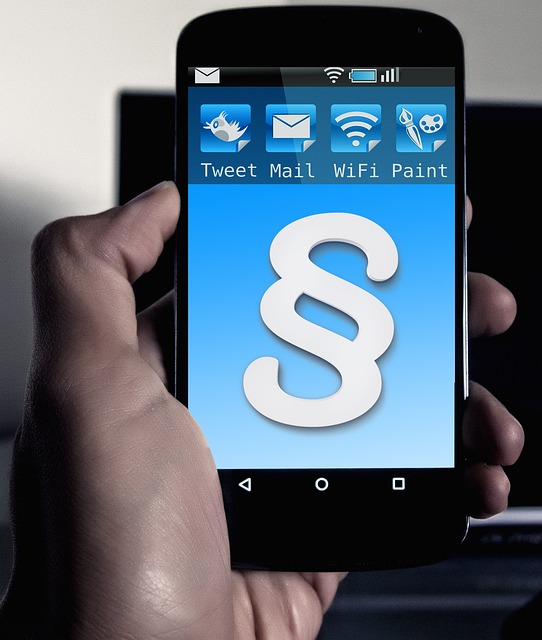
Mobile Device Overview
The smartphone view lists every connected device with real-time status indicators. Green shows normal operation, yellow flags attention needed, and red signals an alert.

Water Usage Tracking
Comparative graphs allow homeowners to review daily, weekly, and monthly water consumption. The platform flags unusual spikes that may indicate leaks or inefficient fixtures.
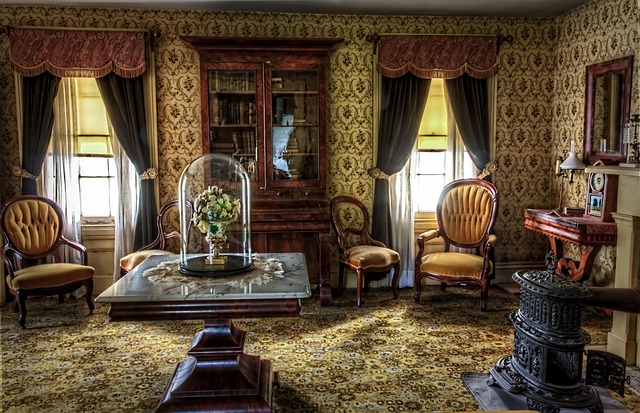
Vancouver Townhouse Deployment
A three-bedroom townhouse in Vancouver integrated 18 devices including smart locks, a Nest thermostat, and leak sensors. The owner now tracks all systems from a single app.
Security Camera Architecture
Diagram illustrating how IP cameras stream footage to our cloud, where motion events are logged, alerts are dispatched, and historical clips are stored securely for review.
Toronto Condo Integration
A downtown Toronto condominium unit connected lighting, HVAC, and window blinds to the platform. The resident manages energy schedules aligned with off-peak hydro rates.
Heating Efficiency Report
Seasonal analytics tracking furnace runtime, heat loss patterns, and indoor temperature stability. Reports help Canadian homeowners prepare for winter and reduce heating costs.

Automation Rules Builder
The visual rules engine lets homeowners create custom if-then automations. Set lights to dim at sunset, lock doors when everyone leaves, or activate cameras on motion detection.

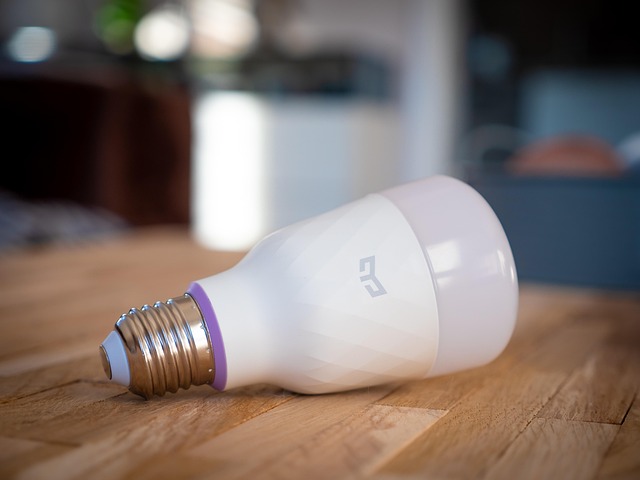
Zigbee Lighting Network
Mesh network topology showing how Zigbee-enabled bulbs and switches communicate through a central hub that relays commands to and from our cloud platform.

Calgary Family Home Setup
A family of four in Calgary connected 24 devices spanning heating, security, and entertainment systems. The platform now provides unified control and monthly consumption summaries.